


Staff vs Children Racial Disparities
Research has shown that having classroom teachers with whom students are able to identify themselves may help children more easily connect to a positive role model and help form trusting relationships.
The maps below display how teachers’ racial/ethnic makeup compares to that of GSRP participants across ISDs. For example, if 10% of the teachers in ISD A are Black, and 50% of the children in ISD A are Black, the ratio will be 0.2 (10% divided by 50%) and the ISD will be labeled as Teachers Underrepresented for the Black racial group. The categories are defined as:
- Teachers Underrepresented: Ratio of 0 to 0.25
- Teachers Slightly Underrepresented: Ratio of 0.25 to 0.5
- Teachers On Par: Ratio of 0.5 to 1.5
- Teacher Slightly Overrepresented: Ratio of 1.5 to 1.75
- Teachers Overrepresented: Ratio of 1.75 and up
To view a specific racial/ethnic group of interest, use the selection bar to the right of the map. The formula to calculate the ratio of teacher percentage and student percentage of a given racial/ethnic group was defined as:
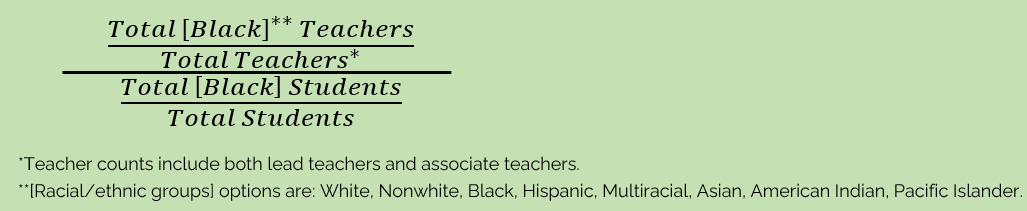
To look at the individual racial/ethnic proportions, the charts below show disparity on teacher and child representation of the specific racial/ethnic group is about the same, proportionally. Specifically:
- 0 = no teacher representation
- 1 = parity
- 2 = teacher representation doubles child representation
- 3 = teacher representation triples child representation
- 3.5 = there is a teacher of the specific racial/ethnic group, but no children of that group present
Please note that the ratios do not take into account the total population of children or teachers, so ISDs with low total population of a given group may have broader variation. Also, the presentation of the data is meant to show a picture of how the teacher population compares to the population of children. It is not meant to be used as a sole judgement on program quality or an overriding factor in hiring decision-making.
To look at each racial/ethnic group individually, click on the tab labeled Individual Groups.
Data Source: Children 2022-23; Teachers: 2021-22